Food web model developed to advance sustainable development in the North Sea
EU-funded EcoScope project partner European Marine Board Executive Director and marine researcher Sheila Heymans co-authored a study titled “A food web model of the Southern Bight of the North Sea”, to be published in September 2024 in Ocean & Coastal Management, together with scientists from the Flanders Marine Institute, Ghent University, and the Royal Netherlands Institute for Sea Research.
The scientists developed the food web model of the Southern Bight of the North Sea (SBNS) to enable quantitative assessment of the impacts of economic activities required for sustainable development of the blue economy in the region, they explained.
The SBNS is the part of the North Sea bound by the coasts of the Netherlands and Belgium to the east and the English coast to the west (see map below).
The model’s indicators suggest that the SBNS ecosystem is likely experiencing “some degree of stress or perturbations” as a result of a combination of overexploitation and eutrophication taking place in past decades, particularly in the 1970s and 1980s.
The researchers stressed that their findings “underscore the importance of implementing an ecosystem-based management framework, and the indicators employed in this study for describing the SBNS food web structure could be valuable for developing quantitative sustainability assessment methods in support of such a comprehensive management approach.”
The SBNS food web model will be useful for simulating potential impacts of future management scenarios, they added. It is a “valuable” first step towards the development of a digital twin of the SBNS, itself a holistic decision-making tool serving comprehensive ecosystem-based management, and allowing the exploration related to both local socio-economic activities and global trends, such as climate change, in the marine environment, they said.
Thirteen ecological indicators and two estimated fisheries indicators were used in the model to assess the environmental state of the SBNS. The indicators were also compared to existing food web models covering the wider Southern North Sea as a whole, which includes the SBNS and the area of the North Sea to its north stretching to the coasts of Scotland and Denmark (see map below).
The model highlighted important differences between the SBNS and Southern North Sea as a whole and their respective food webs, in terms of their composition, complexity, stability and resilience, despite their similarities as overlapping marine regions, the researchers said, with the SBNS displaying a higher level of stability.
The SBNS and Southern North Sea also have noteworthy differences in terms of the fishery practices observed. In the SBNS primarily demersal species are targeted – these are the species living at or near the bottom of the sea, such as flounder, halibut, plaice, sole and turbot. (See the graphic below.) In the Southern North Sea fisheries target both demersal and pelagic species; pelagic species include herring, mackerel, tuna, sprats and sardines.
The researches noted that the trophic flows in the SBNS were “complex”, being supported by multiple pathways, and characterised by high levels of benthic detritus recycling.
The model, constructed based on the year 1991, described dietary relationships between 43 functional groups in the ecosystem, as well as both commercial and recreational fisheries.
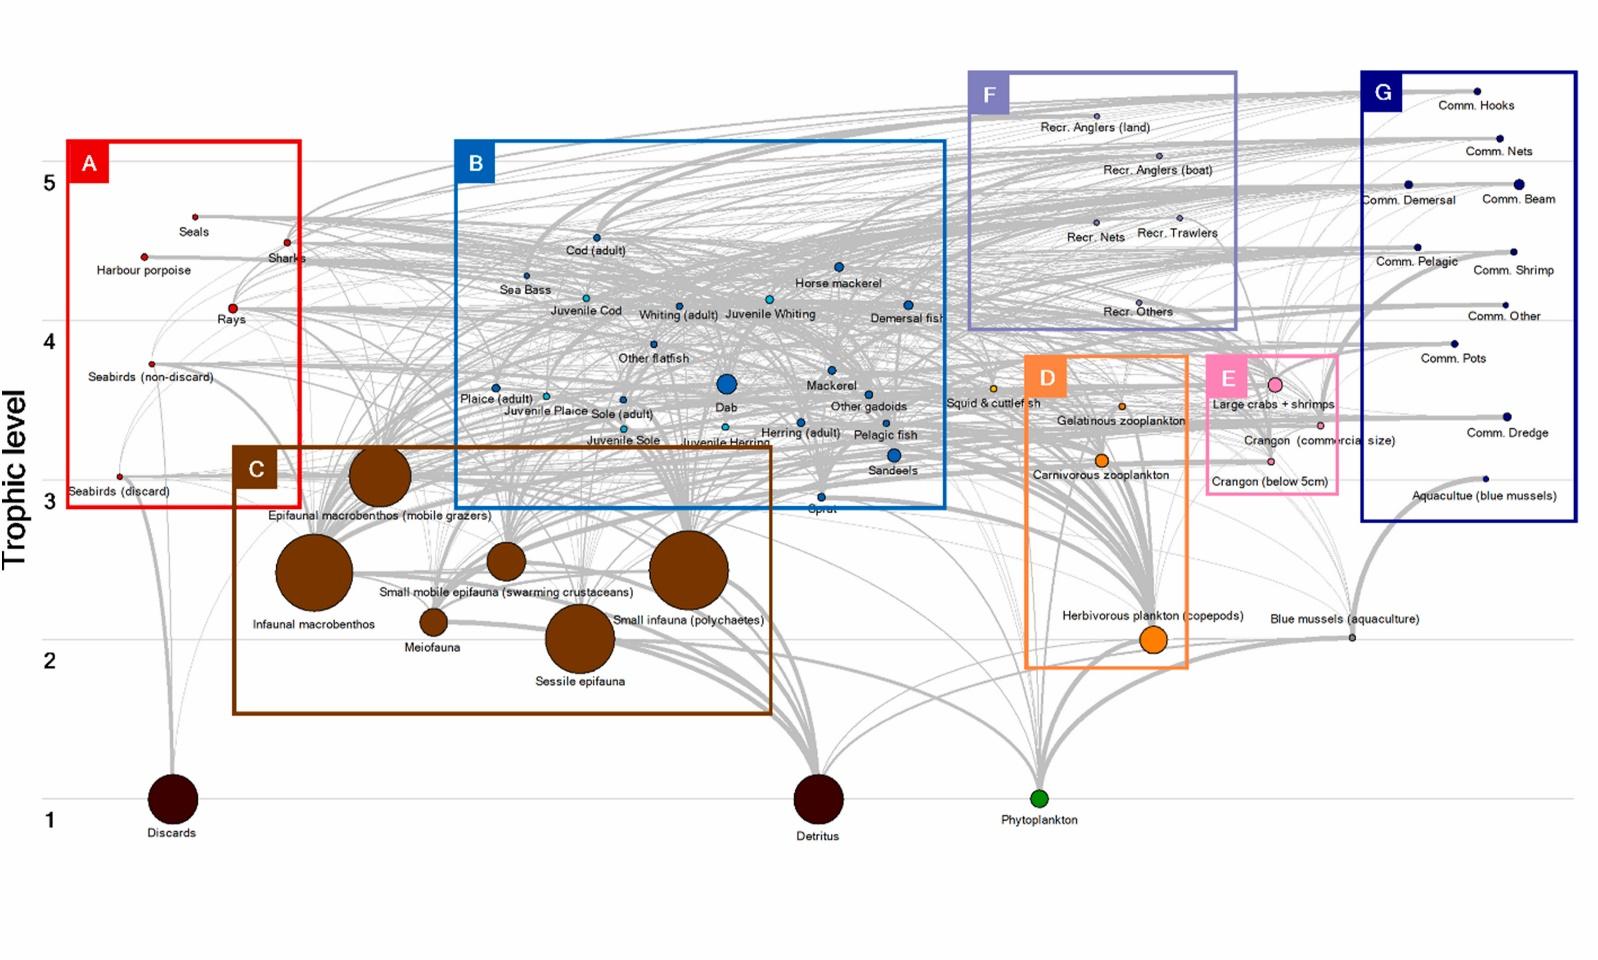
Visual representation of the food web model for the Southern Bight of the North Sea. Each functional group and fisheries fleet is represented with a circle indicating its estimated biomass, with the trophic level represented on the y-axis. Boxes highlight related functional groups and fisheries fleets: (A) apex predators, (B) fish, (C) benthos, (D) zooplankton, (E) crabs and shrimp, (F) recreational fisheries and (G) commercial fisheries including mussel aquaculture. The grey lines represent the connections between functional groups based on dietary composition.
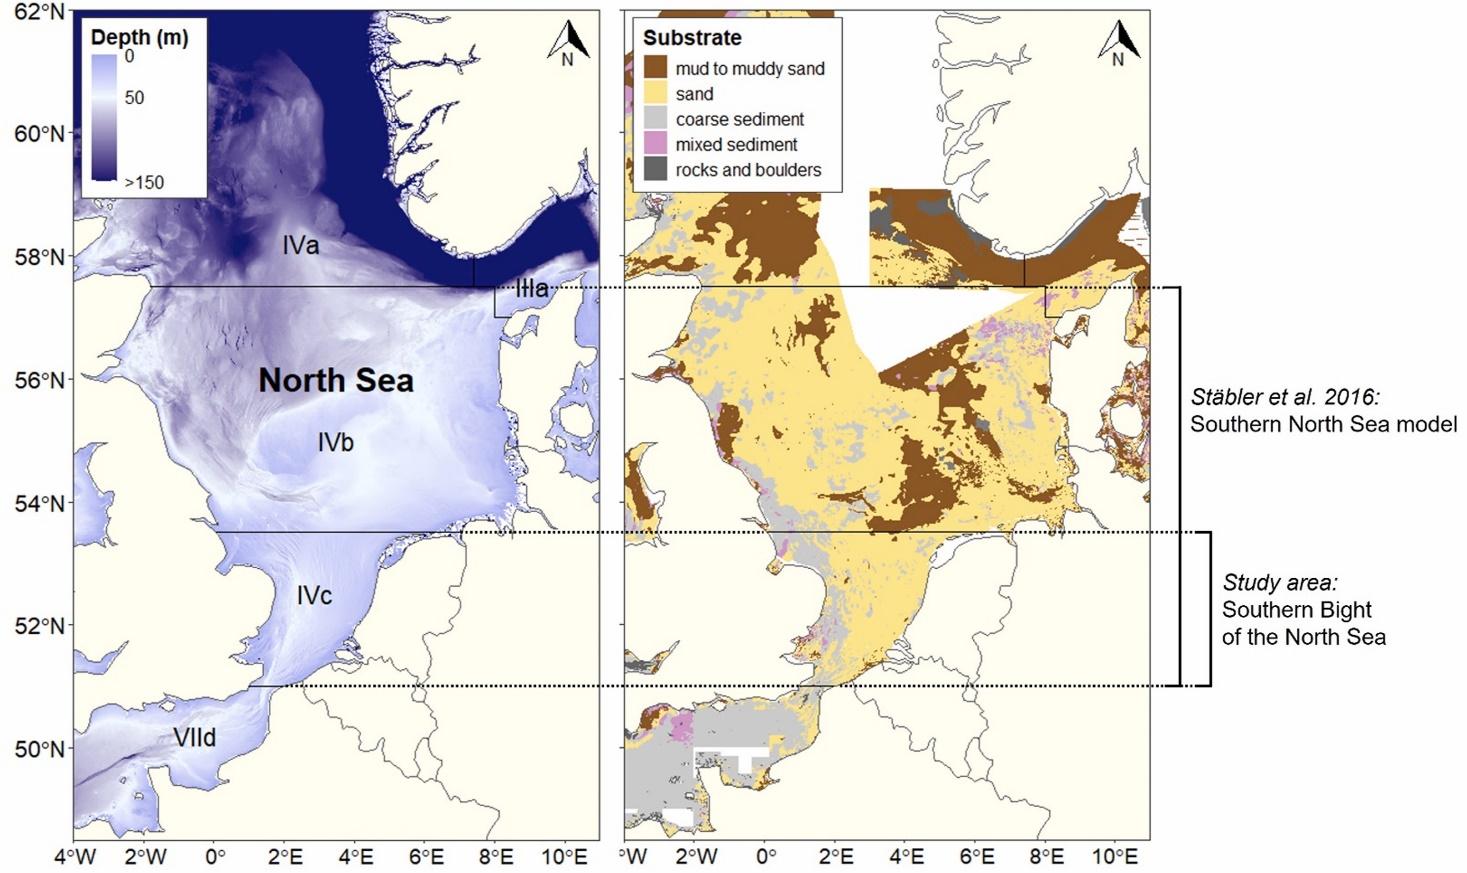
Map of the Greater North Sea ICES Ecoregion divided into subregions (IVa, IVb and IVc) for bathymetry (left) and seabed substrate (right). The Southern Bight of the North Sea is indicated (see note to the right of the figure), as well as the (overlapping) scope of the Southern North Sea model.